Ordnance Survey has said ‘everything happens somewhere’, and this could not be truer when discussing the issue of climate change. The causes, interventions and impacts of climate change are distributed differently, and occur at local, national and international scales.
Geographic Information System (GIS) – a collection of software and processes which can collect, analyse and present spatial information – and the associated profession are key to this earth-scale issue. TEP’s GIS team has this in mind when completing projects on Green Infrastructure, Ecosystem Services (ESS) and Natural Capital.
GIS is able to collect spatial data from several sources, including site surveys, aerial photography and LIDAR (Light Detection and Ranging). Through mapping the issues or phenomena associated with climate change (such as land-cover change), GIS can help to establish a baseline of information, which can then be measured and monitored to achieve targets. As part of our Green Infrastructure Assessments, TEP looks to quantitatively measure land-cover and establish a spatial baseline, with the aim to set measureable targets to reduce the coverage of sealed surface, a contributor to climate change.
Furthermore GIS can address the issue of climate change through spatial modelling and analysis. Looking at different spatial datasets, it is possible that GIS can identify causality between phenomena, and identify what factors contribute to climate change (such as deforestation). If we are able to understand causality within the climate system, we can model the impacts of climate change, and those of potential interventions across a given area. Spatial modelling helps to inform decision makers on the most effective places to allocate resources and also helps to identify the most effective interventions to maximise the response.
Within our work on ESS Opportunity Mapping for Greater Manchester, TEP included carbon sequestration as a service, and identified the optimum locations to improve it. We have been able to inform decision-makers on the locations to have the most effective impact on climate change through interventions such as afforestation.
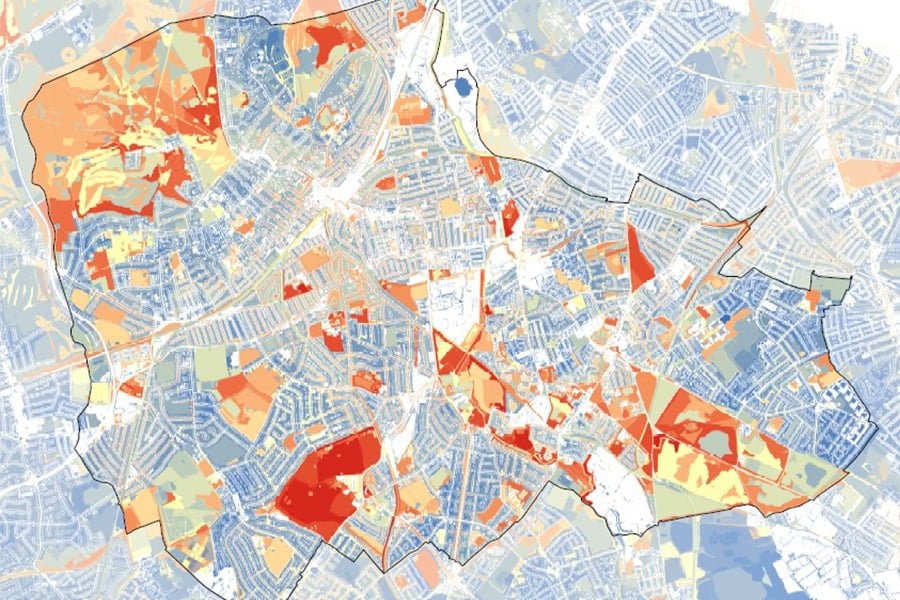
It is important to have a comprehensive evidence base to inform decision-makers, however it is just as important to be able to communicate the results in a clear and accurate manner. As the cliché goes ‘a picture speaks a thousand words’, and GIS has the ability to present the results of data collection and analysis through a variety of media – maps, applications and visualisations. This is a key link between science and policy, as clear communication of ideas is critical to the best decisions being made.
At TEP, the GIS team has produced maps for a number of evidence bases to support climate change interventions such as tree planting. We also have produced webmaps, which allow decision makers to interact with the spatial data generated without the need for specialist software.
Climate change is an issue which will affect everyone on Earth, and GIS has the power to map, measure and model the impacts and interventions. The GIS profession must play our part in addressing this issue in the day-to-day work we do.
To discover how our other teams are contributing to climate action follow the links the below:
Environmental Planning
Ecology
Arboriculture
Landscape Design
Landscape Management
or to get in touch about our GIS and carbon sequestration services, please email GIS@tep.uk.com